
Akademie
- 2. blok - Diagnostic methods
- Series diagnostics (počet lekcí: 0)
SuperVAG or VCDS Scan Tools - Excel graphs from recorded logs


Úvod
SuperVAG a VCDS diagnostic tools – effective troubleshooting of VW group vehicles - 1.9 TDI engine as an example
The VAG COM program among other functions has the ability to perform recordings. This is a strong feature when troubleshooting vehicle problems. The ability to use the program and a few measuring tips from the workshop will save every technicians time and trouble.
LOG recordings - purpose
A diesel engine requires for good performance the correct values at the correct time. Monitoring several values from different groups during a test drive is not possible. Another argument is that in the dynamic driving modes we can detect more faults, that will be described.
SuperVAG & VCDS - data recording procedure
After establishing communication with the engine ECU we select the groups that we want to record. For the basic and first engine performance test we select groups 003, 008 and 011.
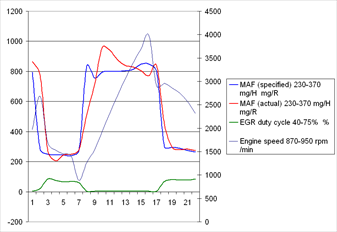
Group 003 contains information about:
Engine speed, Air mass target, Air mass actual, EGR control solenoid duty cycle.
Important note:
The air mass value quoted as "requested" is in fact specified as in relation to the EGR valve and means that on the graph in the area below the trace line (that is when the engine is intaking at partial load this amount of ait) is a zone, where the control unit can activate the EGR system. To understand this as being a requested value by the control unit in all modes is a big and often very common mistake.
1. Air mass is positively too low
If the air mass sensor is giving correct readings, the cause could be in the low performance of the turbocharger (all possibly causes from a dfective turbocharger to a non-functional electropneumatic charge pressure actuator, etc). The problem could be in a leaking or non-fuctioning EGR valve. If the EGR valve is partly open the pressure in the exhaust system causes that the exhaust gases are flowing to the intake system and the engine at full load has no power and smokes heavily. The problem could also be caused by strong crankcase blow by of gases. To test this, remove the crankshaft ventilation hose from the intake manifold and let it blow into the atmosphere. The cause could be in a restricted air filter (a diesel engine requires a lot of air) or it could by a restricted exhaust (back pressure is present but the flow is restricted).
2. Air mass is OK but air mass sensor reading is incorrect
We test if the air mass sensor is defective in two ranges. In idle and at load in the following ranges 2500, 3000 and 4000 RPM. The air mass should achieve the correct values in all these ranges. During the test we should disconnect the air filter intake hose so that there is no restriction, we should have a disconnected EGR valve (before this we should check if the valve is closed), we should have a disconnected crankcase ventilation and a non-restricted exhaust system. A good idea is to have a verified air mass sensor that we can install for testing.
Log-file recording
The VAG COM program contains in the block of measured values a LOG function. When you activate the function a file name appears in the bottom line of the screen, that can changed to any required name. So the default name e.g. LOG-01-003-008-011.CSV can be changed to e.g. “SmithOriginal.csv”.
Default file format “LOG-01-003-008-011.CSV or your own name “SmithOriginal.csv”
this CSV file can be edited with MS Excel or another spreadsheet editor. Here are a few tips how to handle these files:
If the file doesn't sort properly into clear columns and looks like this:
Thursday,04,September,2003,16:11:49 038 906 019 KE ,,G000SG 4898, ,Group A:,'003,,,,Group B:,'008,,,,Group C:,'011 ,,RPM’s,Air/Stroke,Air/Stroke,Duty Cycle,,RPM’s,injected quantity, injected quantity, injected quantity,,RPM’s,(without units),(without units),duty cycle ,TIME,,,,,TIME,,,,,TIME,,,, MARKER,STAMP, /min, mg/R, mg/R, %,STAMP, /min, mg/R, mg/R, mg/R,STAMP, /min,,, % ,0.32,819,250.0,245.0,60.2,0.66,840,0.0,30.5,20.9,0.00,840,1044.0,984.0,19.9
,1.32,819,250.0,245.0,60.2,1.64,840,0.0,30.5,20.9,0.98,819,1044.0,984.0,19.9
,2.30,819,250.0,249.9,60.6,2.64,819,0.0,30.5,20.9,1.98,819,1044.0,984.0,19.9
You can be assured that your PC is not set correctly. Excel or another spreadsheet editor hasn't recognised the column separator and has put all the figures into one column.
Excel or your PC settings for correct column recognition
The VAG COM system uses the “comma” as the separator. So set your PC to use the correct separator. Go to START - Control Panel - Region and Language - Additional settings and in the List separator box change the setting to a "comma" (it's usually set to a semicolon"). If you're not confident with the PC ask somebody can change the settings. Now your log should show up correctly.
How to create a graph from the table, see the video in the "file" folder...

Excel - Graph from the SuperVAG Log file - Grafik aus VCDS Datei - guide (1729/1)
The SuperVAG and VCDS log files have a "csv" format and with Excel they can be transformed to graphs. This is shown in our short video.
Short video description: The SuperVAG (HR Carsoft) and VCDS (Ross-Tech) diagnostic tools in conjunction with a Micro-CAN tool Diag4t it is possible to record the actual vehicle data into a LOG file (this can be activated during recording by a function "store in intervals into PC memory"), which can be further processed into a very pleasant graphic format and modified in Excel.
After the file is opened in Excel, we can see the values in columns. If we mark the entire column of values together with the header, which we uploaded, for example, while driving (either we mark the area of the table cells with the mouse with the left button pressed, or we press the "Shift" key and use the arrows to mark the table area from the default top left corner in the direction down right. So that clicking the down arrow on long records does not take too long, after marking the columns, we can mark only a few cells vertically, and then press the key together with the pressed key "End" a then immediately key "arrow down". With this we achieve that all used cells are selected vertically to the end of the table.
With this selection we choose the command "insert" and select the symbol "graph". It is good to expand long records in a spreadsheet for evaluation as seen in the video...
We hope that this guide will help you work with records quickly and routinely...
Full load reference values for all VW 1,9 TDi engines (1729/2)
When the air mass sensor is tested it is necessary to increase the engine speed from about 1500 rpm to 4000 rpm by quickly activating the accelerator pedal to a fully open position. By recording this into a LOG file we will have air mass sensor values that we can compare with the manufacturer given values for these engines.
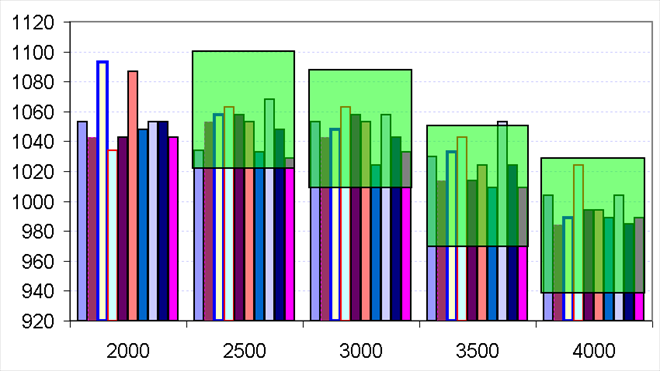
These are the test ranges for air mass sensors (valid for all 1.9TDi engines)
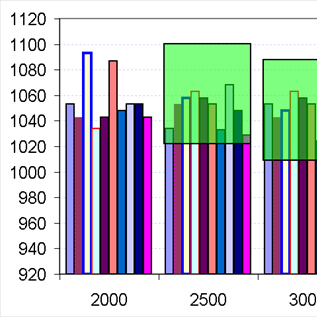
The test range is from 2000 to 4000 rpm. When the accelerator is fully pressed down the values of all engines should have the below stated values:
2500 rpm – from 1020 mg/H to 1100 mg/H
3000 rpm - from 1005 mg/H to 1090 mg/H
3500 rpm - from 970 mg/H to 1050 mg/H
4000 rpm - from 940 mg/H to 1040 mg/H
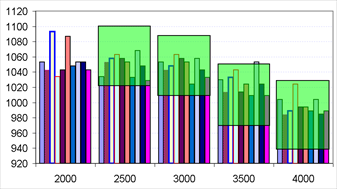
Defective trace of a tired air mass sensor (1729/3)
The picture shows a typical situation of a tired air mass sensor. This is a common condition of most 1.9TDI engines after about 55 000km of driving, when tested. The values do not reach the specified as shown by the graph.
CAUTION!
Group 003 shows information about:
air mass specified to EGR
air mass actual
EGR valve actuator duty cycle
Explanation:
The air mass value quoted as "requested" is in fact specified as in relation to the EGR valve and means that on the graph in the area below the trace line (that is when the engine intakes at partial load this amount of air) is a zone, where the control unit can activate the EGR system. To understand this as being a requested value by the control unit in all modes is a big and often very common mistake. At max. load the air mass actual value has to exceed this trace line considerably (see graph).

Komentáře (0)